Industrial and logistics rents accelerate again in a very tight market - JLL
Contact
Industrial and logistics rents accelerate again in a very tight market - JLL
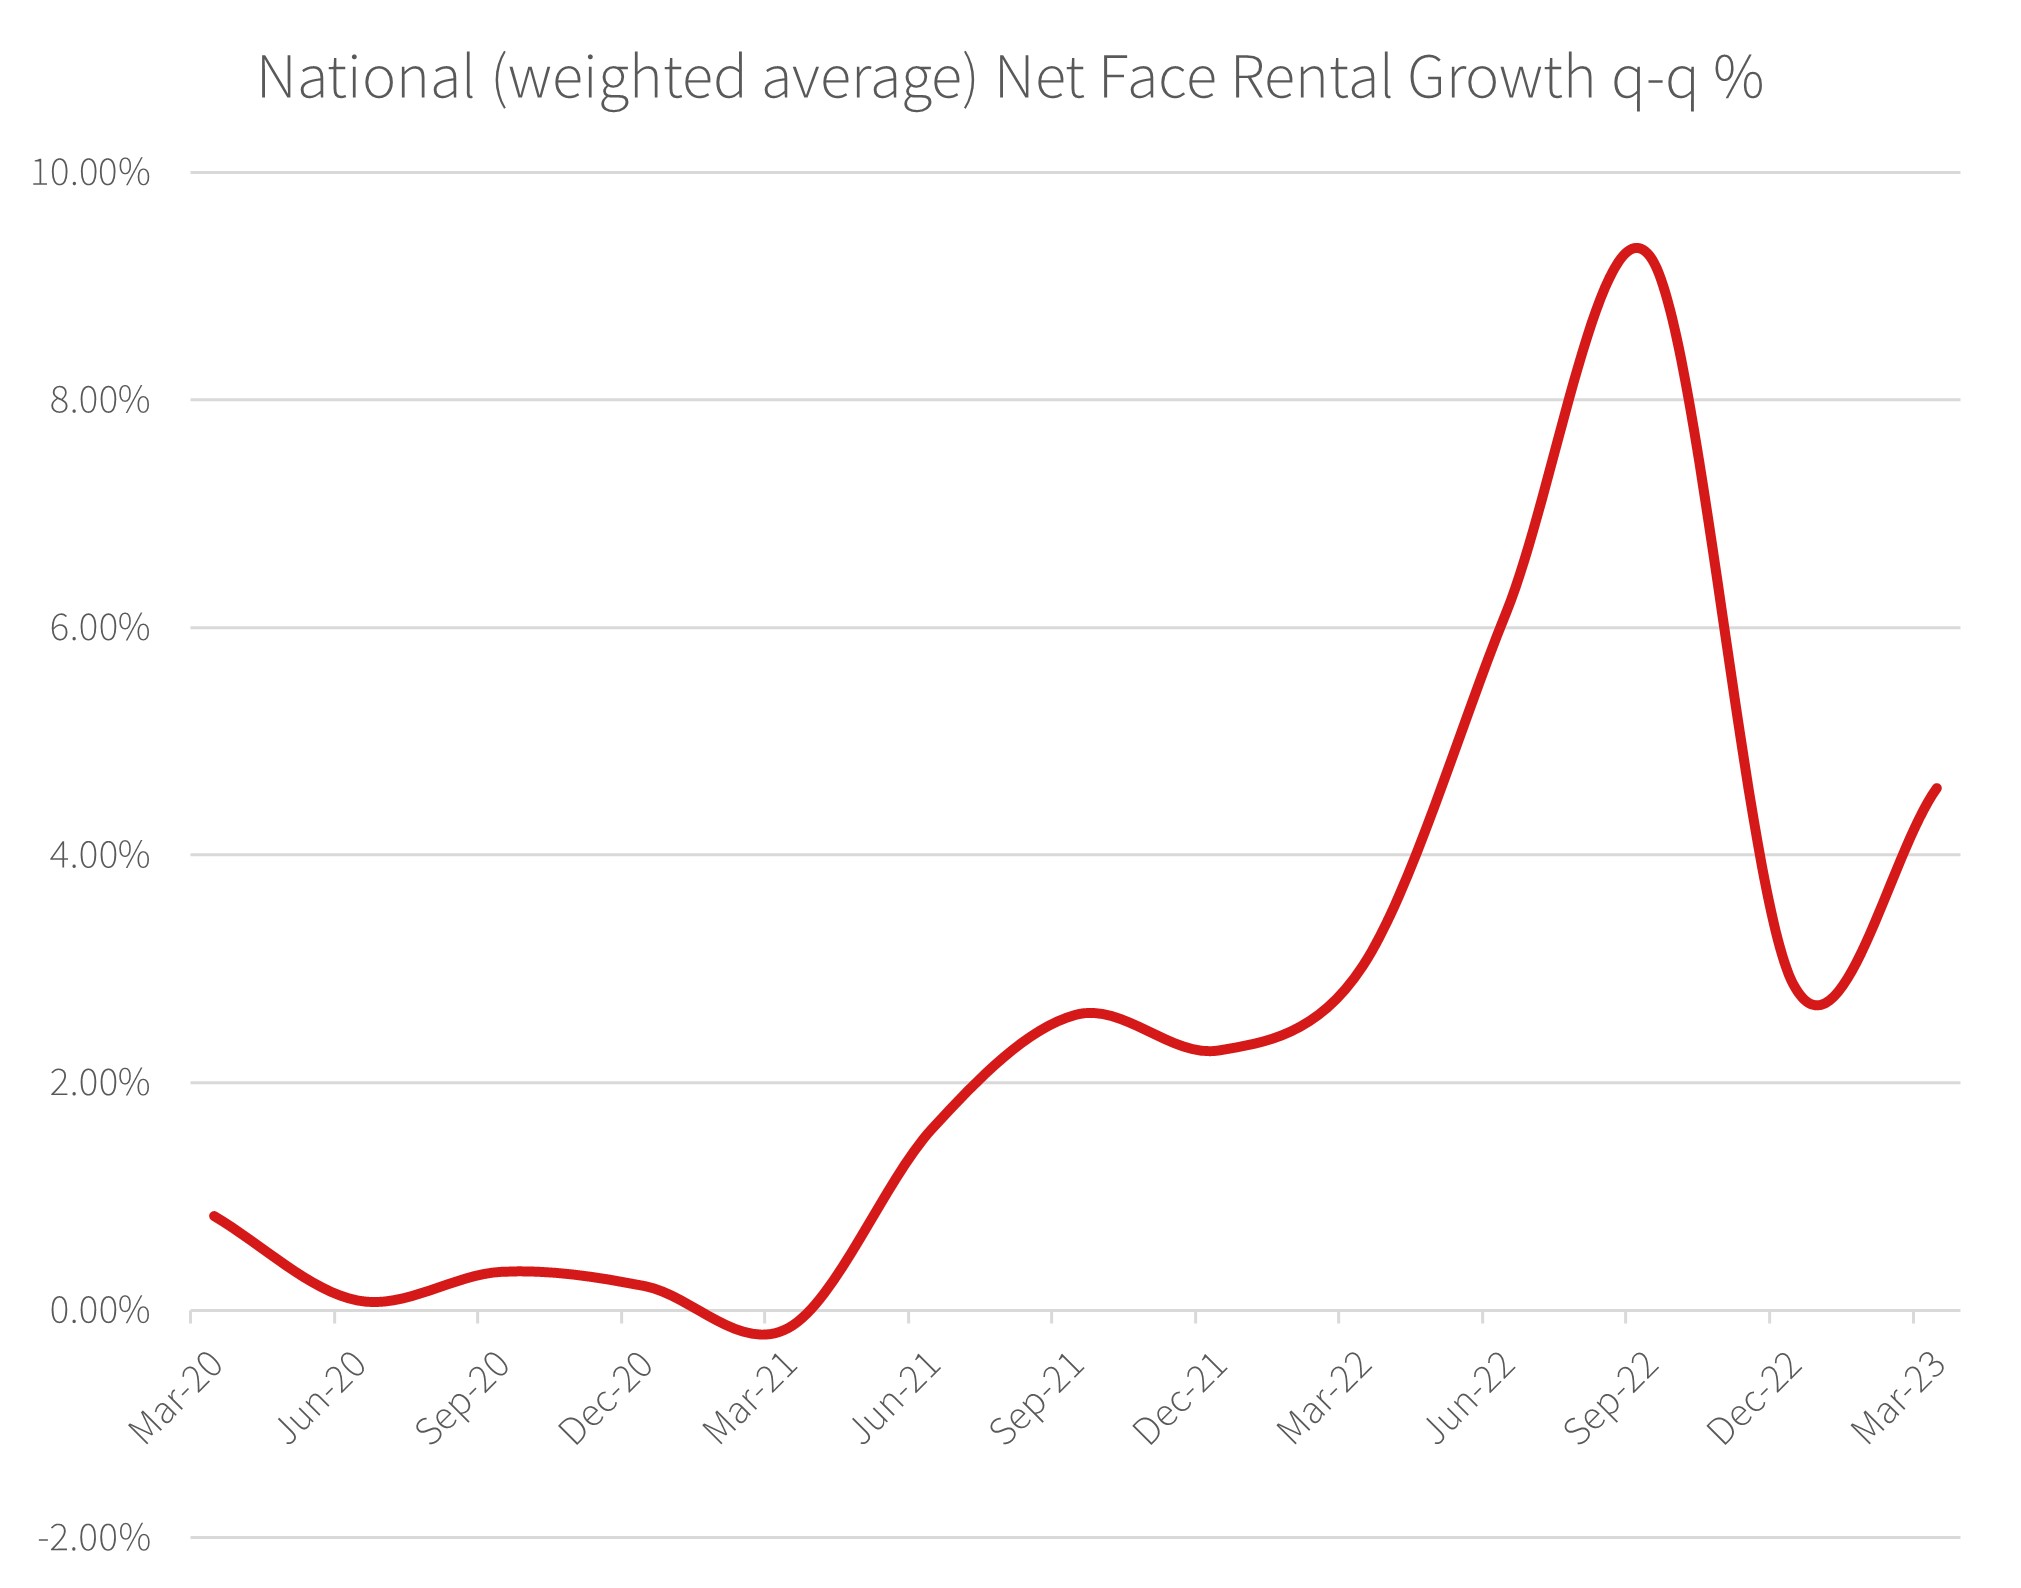
National prime existing industrial rents grew by 24.8% over the last 12 months recording the strongest annual rental growth since JLL began tracking the market 34 years ago.
National prime existing industrial rents grew by 24.8% over the last 12 months recording the strongest annual rental growth since JLL began tracking the market 34 years ago. The March quarter reading at 4.6% growth quarter-on-quarter illustrates market acceleration again, exceeding more moderate growth in 4Q22 (2.9%) and following the extraordinary quarters of growth in 3Q22 (9.3% q-q) and 2Q22 (6.1% q-q).
East coast markets performed very strongly in 1Q23 delivering yearly rental growth ranging from 20% to 40% in key markets.
JLL’s Head of Industrial and Logistics – Australia, Peter Blade said, “We anticipate that rental growth will remain strong this year even as economic challenges create business caution. The supply demand imbalance created in 2021 is taking time to reset. The development pipeline is building.”
Institutional developers are using the strong rental growth environment to speculatively build new product. The aim is not only to capture rents closer to practical completion which can be significantly higher, but also aim to minimise risk in the construction process which is important given challenges with material supplies, construction worker shortages and higher financing costs.
JLL’s Head of Strategic Research – Australia, Annabel McFarlane said, “We are tracking 46 (out of 82) under construction projects expected to deliver 730,000 sqm of space to the market without any level of pre-commitment. Strategies to build speculatively, without securing a tenant first, target the Eastern Seaboard states with 42 out of 46 projects in Sydney, Melbourne or Brisbane.”
Mr Blade said, “The challenge for occupiers has continued into 2023. Whilst there are some instances of delayed decision making because of the current economic uncertainty, those tenants that do choose to sublease are doing so as a revenue generating exercise, tapping into the rental difference between passing rent and market rents which for some leases in some markets can be 30%, 40% or 50% higher. The market is desperate for more space so this is an easy option.”
Summary - JLL 1Q23 Research figures – Industrial and Logistics:
National rental growth:
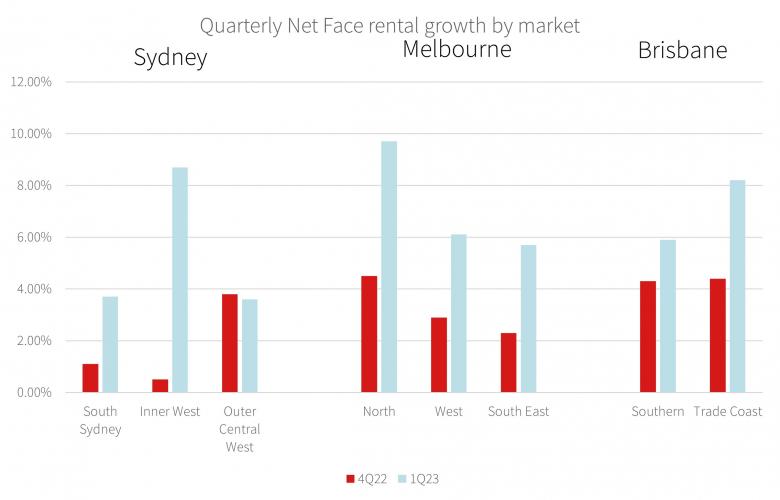
In Sydney the Inner West market recorded the strongest net face rental growth for the first quarter with 8.7 % q-q and 9.7% q-q for prime and secondary assets respectively. Except for Sydney’s north (5.1% y-y) which recorded solid annual rental growth only, Sydney’s industrial precincts have seen prime existing rental growth over the last 12 months ranging from 22% y-y in Inner West to 40% y-y in Outer Central West. To exacerbate the challenge for tenants, incentives remain in single digits.
Extreme lack of space options in Melbourne has pushed occupiers to secondary assets and driven rental growth strongly again. Melbourne’s West recorded quarterly rental growth of 9.7% q-q for Prime and 12.8% q-q for Secondary assets. Melbourne’s South East market was nearly as strong recording 6.1% q-q for Prime and 11.4% q-q for Secondary. West and South East precincts in Melbourne have recorded between 30% and 35% over the last 12 months on average with marginally stronger growth in secondary stock. Incentives continue to edge lower ranging from 5% to 15%
Brisbane’s Trade Coast market was the standout performer in QLD with net face rental growth 8.2% q-q for prime assets and 7.6% q-q for secondary assets and annual rental growth 21% and 23% y-y respectively.
Demand - take-up of industrial space by occupiers:
National gross take-up of industrial space has been curtailed by lack of options in many markets and first quarter take up is below average nationally recording 432,630 sqm compared to a quarterly average of 685,100 sqm over the last 10 years.
Supply:
Nationally new completions in the first quarter are well down with 256,100 sqm completed in 1Q23 compared to a 10 year quarterly average of 405,400 sqm per annum.
Ms McFarlane said, “Those developments that have completed in the first quarter offer limited options for tenants as they are 81% pre-committed.
“If we look at annual figures for new completions, the 10-year national average total is 1.62 million square metres per annum. By the end of 2023, we anticipate annual completions to total 2.3 million square metres,” she said.


